Use your sensor from a browser, without installing the mobile app. This guide covers the sensor's local website. The app has its own feature set; full parity is still planned.
The left menu holds every page: Dashboard, Wi-Fi, Capture, Spectrum, RF tests, Network tests, RADIUS, Results, Device, Integrations and Security. What you can start depends on the radios and analyzers attached.
The screenshots come from a real Pi 5. Solid dark blocks hide network names, BSSIDs/MACs, addresses and device identities. Select any screenshot to open it full size.
If the sensor is new, flash and claim it first with the installation guide.
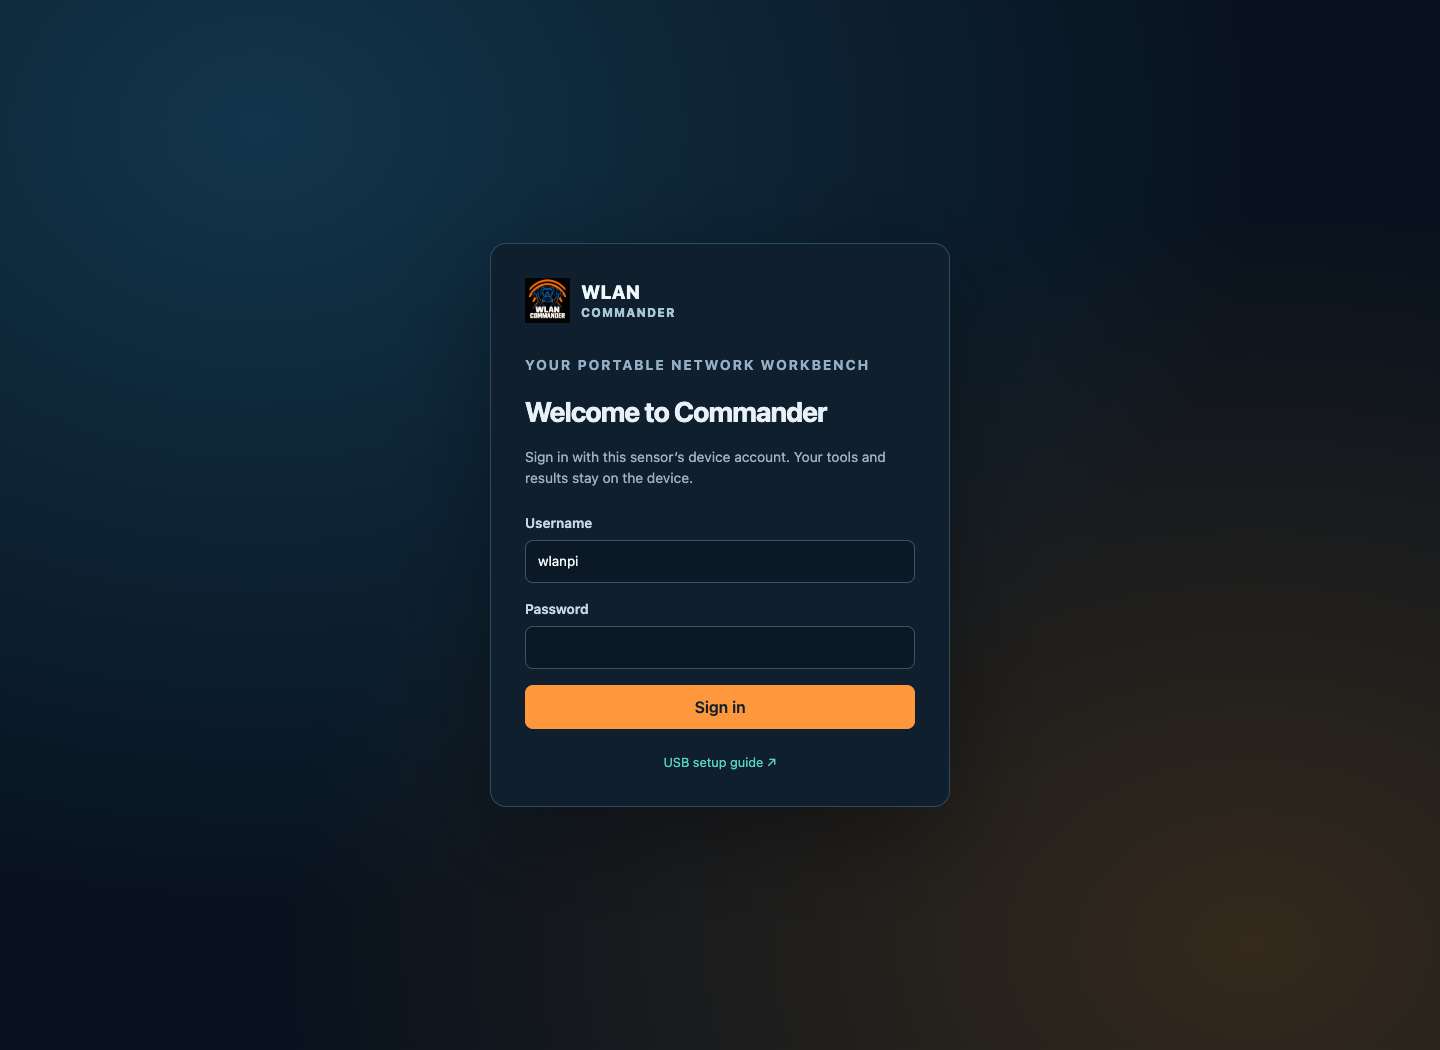
How to sign in and check the sensor's certificate
- Find the sensor. Its name looks like
WC-pi5-…. Openhttps://<name>.local/(mDNS), its address from the front panel or your router, orhttps://198.18.42.1/over a direct USB data connection. - Your browser warns about the certificate, because the sensor made its own. Open the certificate details and find its SHA-256 fingerprint.
- Compare it with the Certificate SHA-256 line in
WC-SETUP.TXTor your installer's record. Continue only if they match.WC-SETUP.TXTis deleted when the sensor is claimed, so keep a copy of the fingerprint. If you later install your own certificate on Security, the fingerprint changes. - On Welcome to Commander, leave Username as
wlanpi, enter the password you chose at setup, and select Sign in.
The Dashboard opens and the header shows Sensor connected. The password is the same one that protects SSH; there is no universal password.
How to run a Wi-Fi tool and download the results
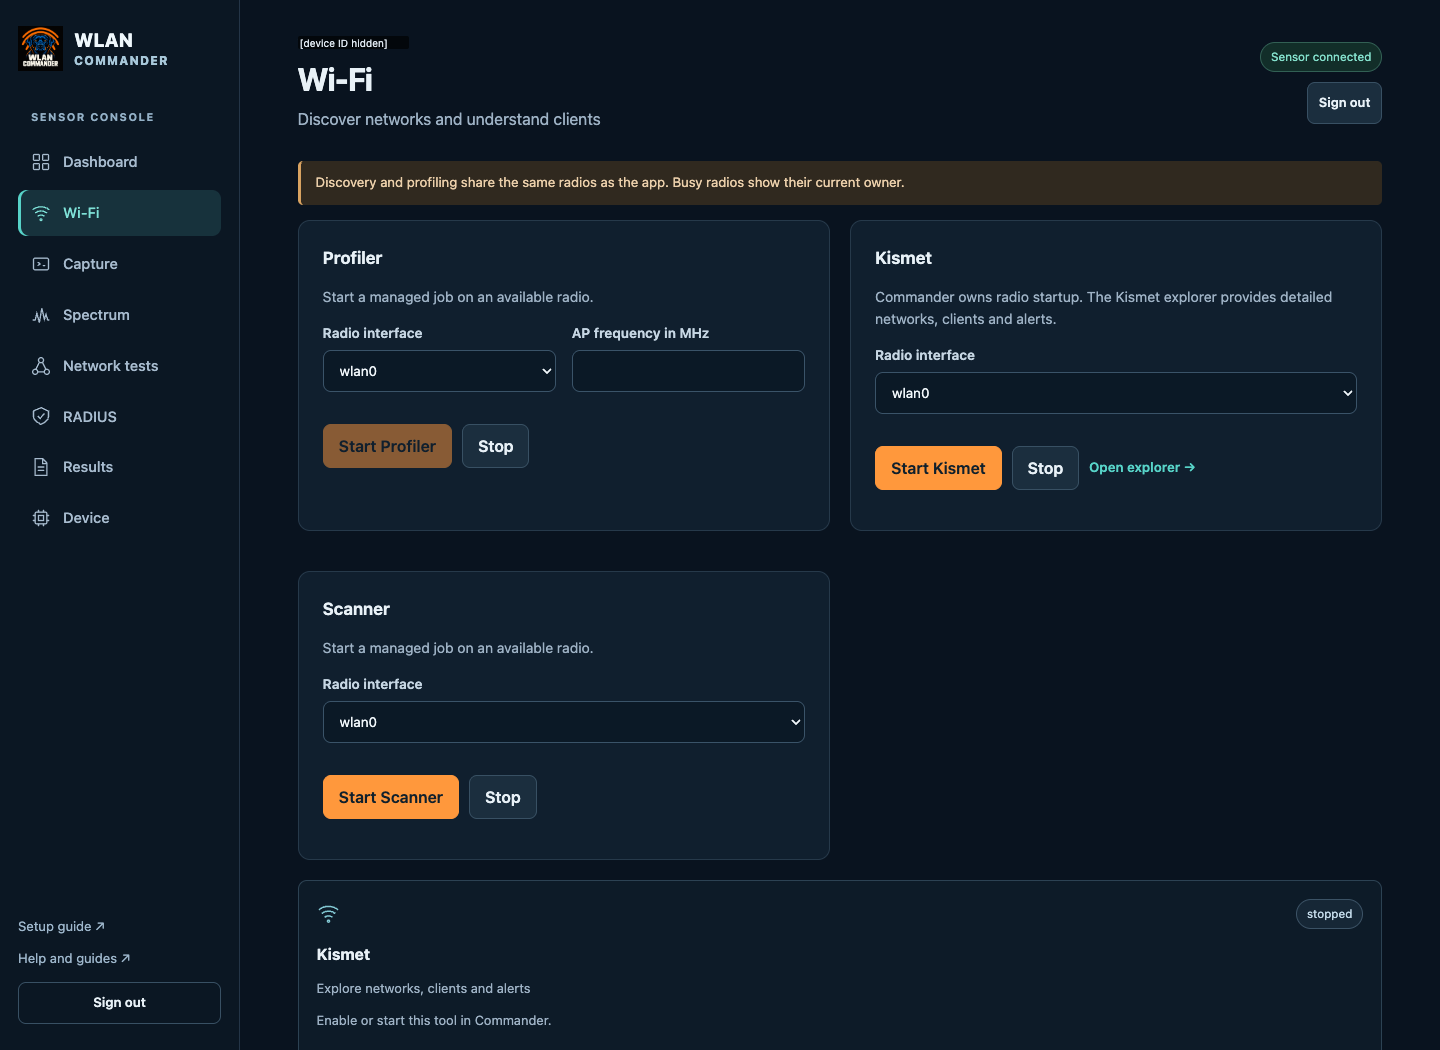
The Wi-Fi page has one card per tool: Profiler, Kismet and Scanner. Each card has its own Radio interface list. A radio already used by another job, or one that cannot run that mode, cannot be chosen.
- Open Wi-Fi and pick the tool's card.
- Choose the Radio interface. For Profiler, also enter the AP frequency in MHz.
- Select Start Profiler, Start Kismet or Start Scanner.
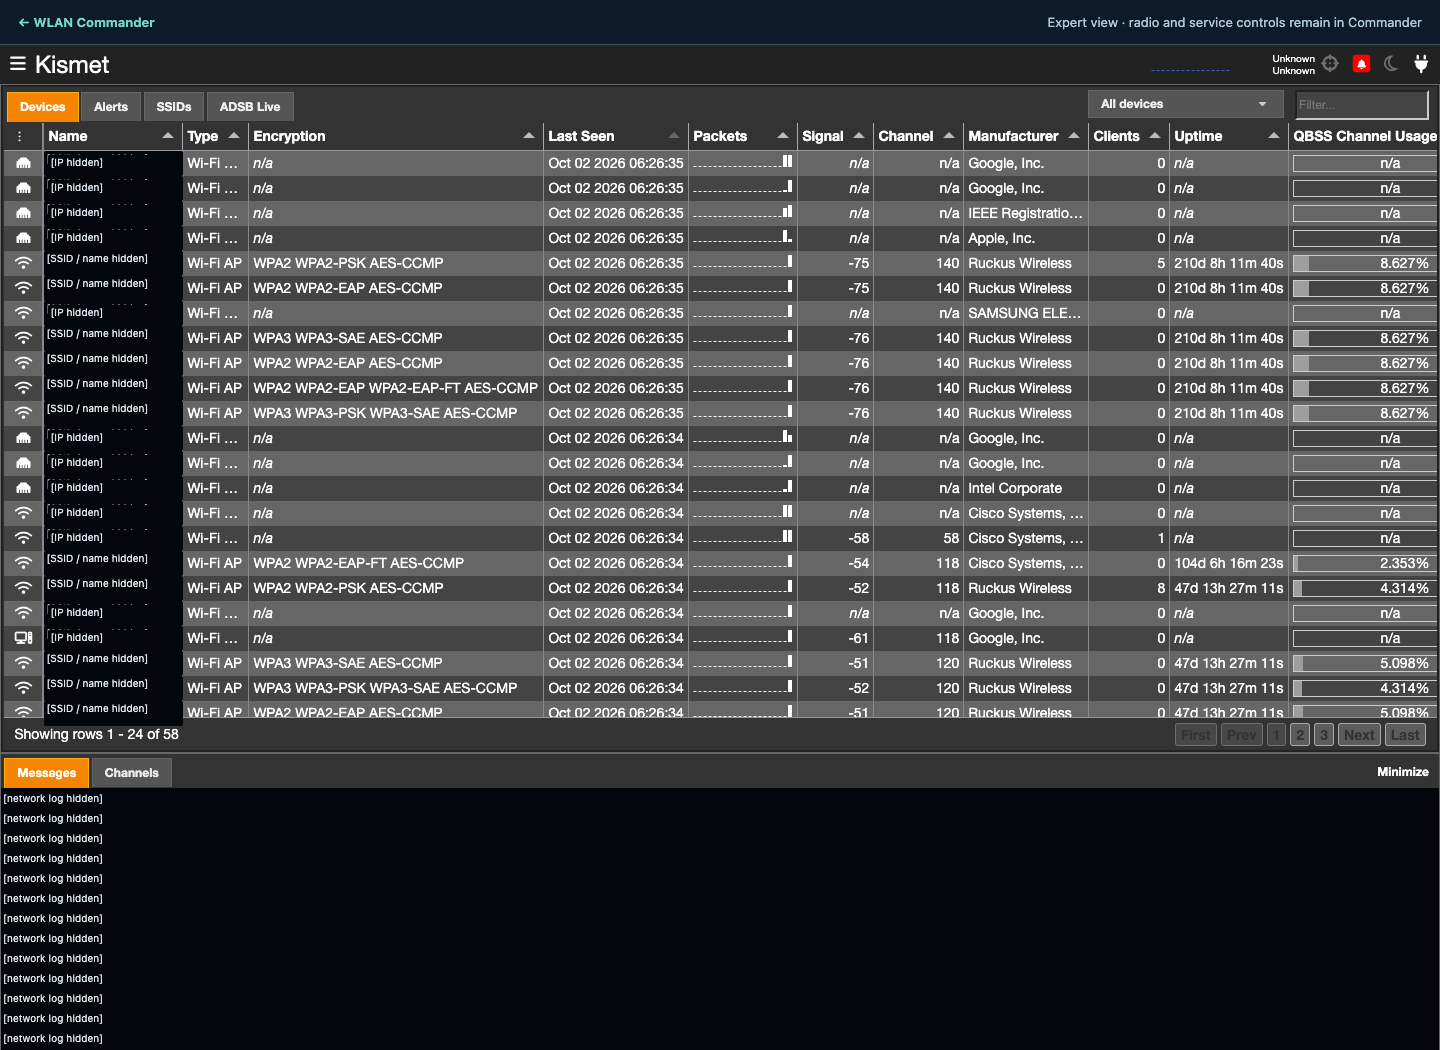
- For Kismet, select Open explorer → to see its Devices, SSIDs and Alerts views. Use ← WLAN Commander at the top to come back. The explorer is read-only; start and stop Kismet from Commander.
- Select Stop on the same card when you are done. This frees the radio.
To record traffic instead:
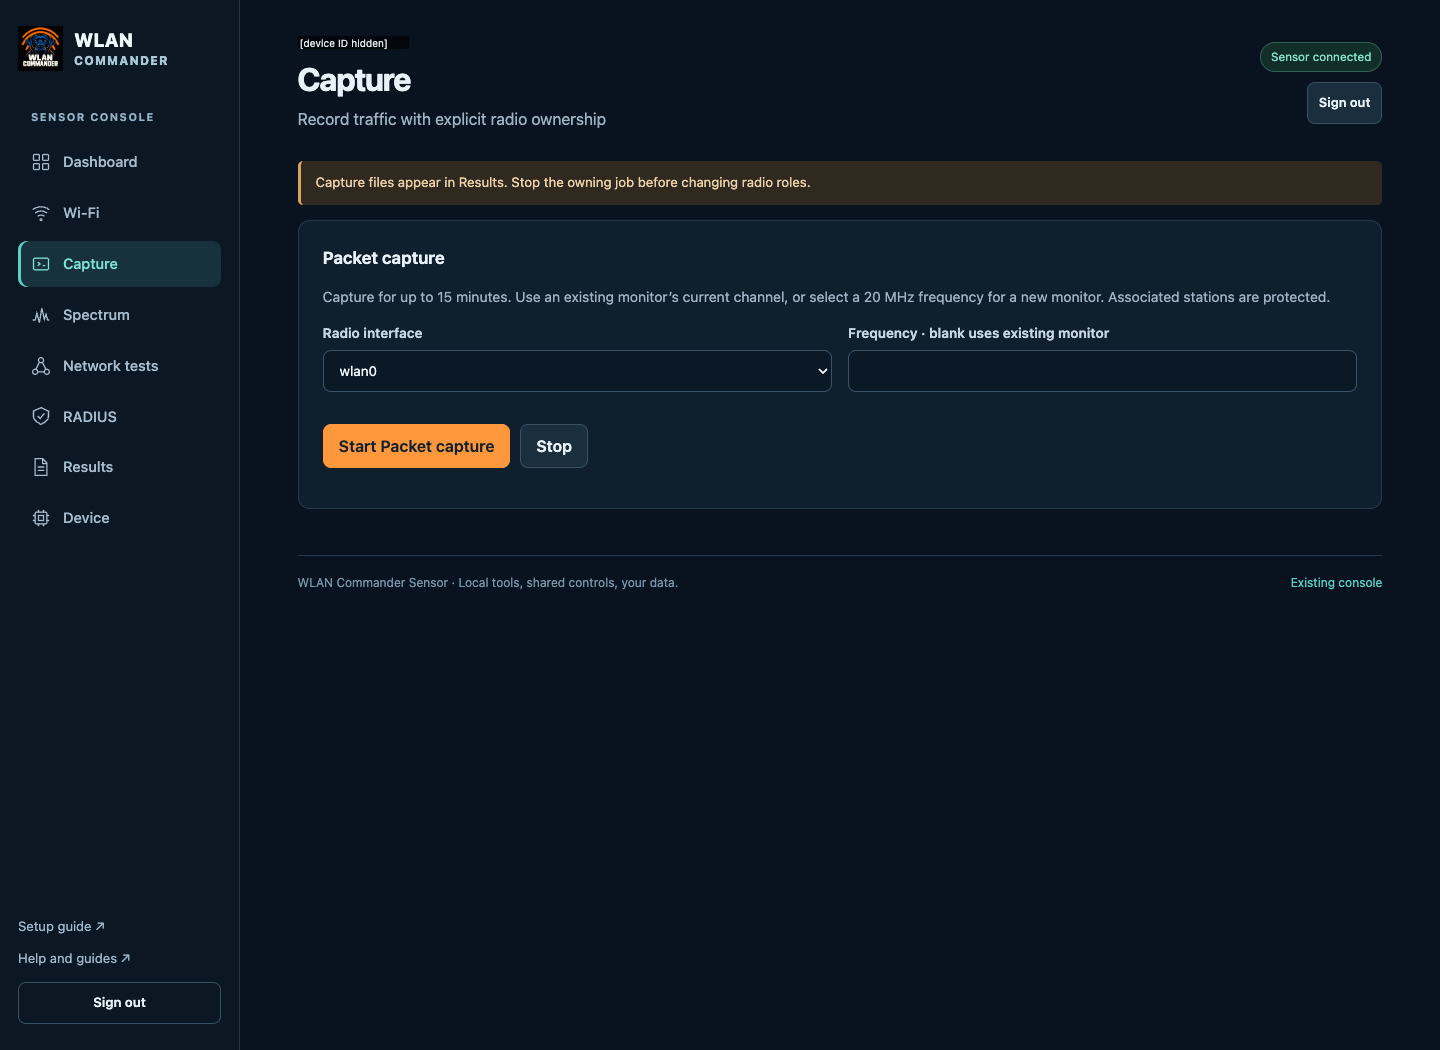
- Open Capture and choose the Radio interface on the Packet capture card.
- In Frequency · blank uses existing monitor, leave it blank to keep a monitor interface's current channel, or enter a frequency in MHz to set up a new 20 MHz monitor.
- Select Start Packet capture. A radio associated to a network is protected; disconnect it first if you want to use it.
- Select Stop when finished. A capture also stops by itself after 15 minutes, and keeps up to four files of 64 MB each.
Then get the results:
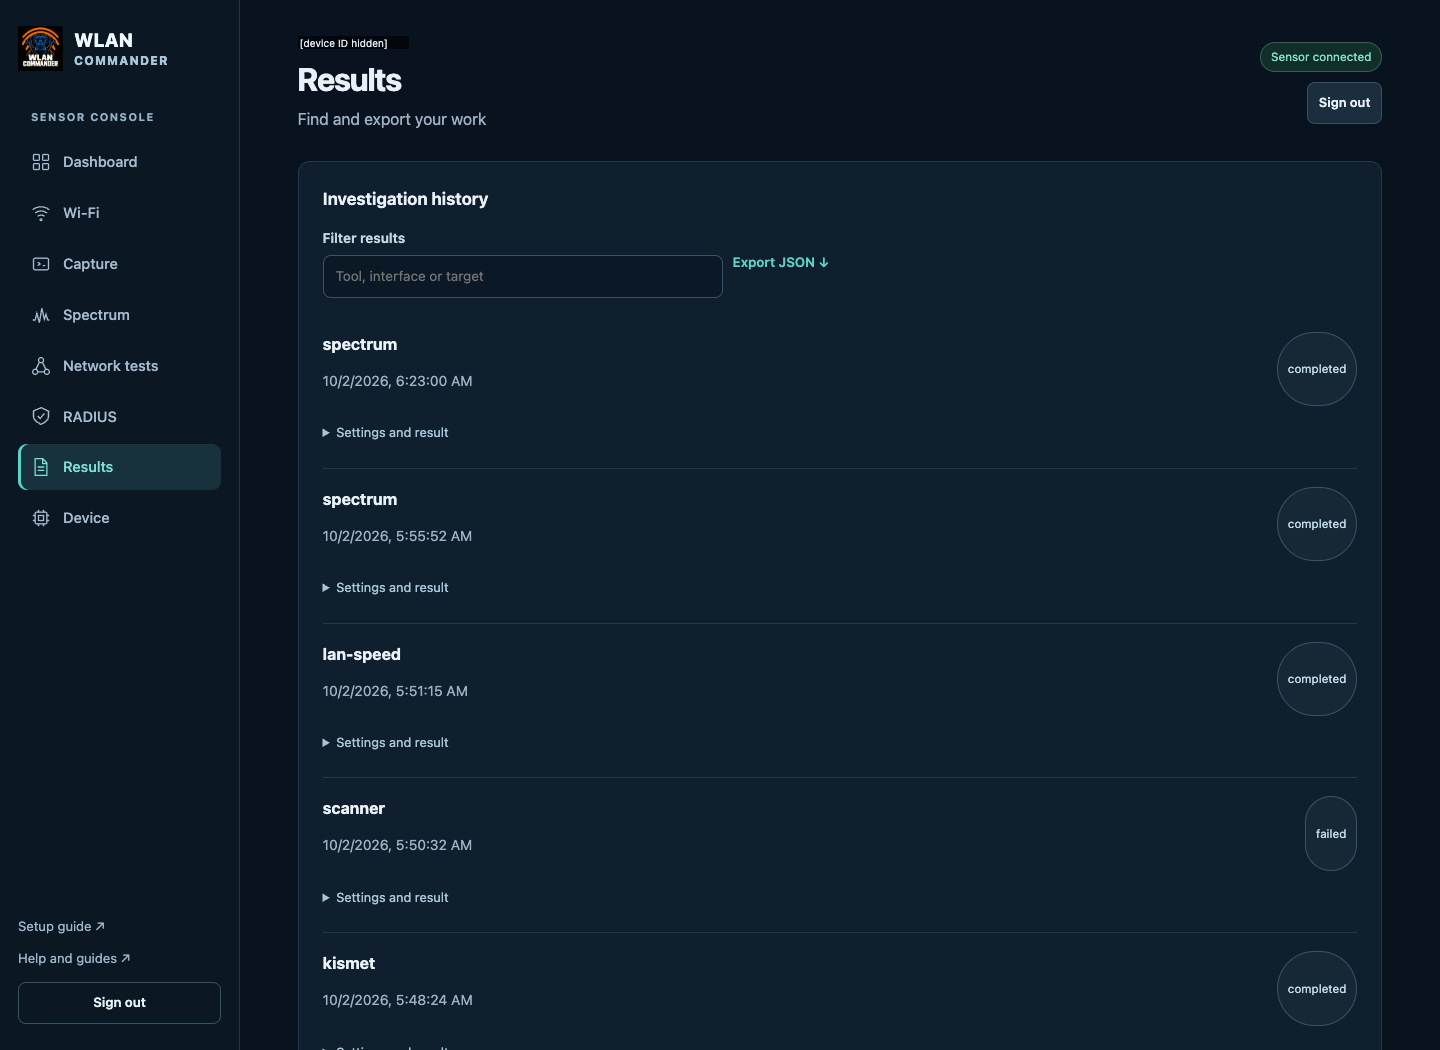
- Open Results. Investigation history lists runs; type in Filter this page to narrow by tool, interface or target.
- Expand Settings and result on a run to see what it did.
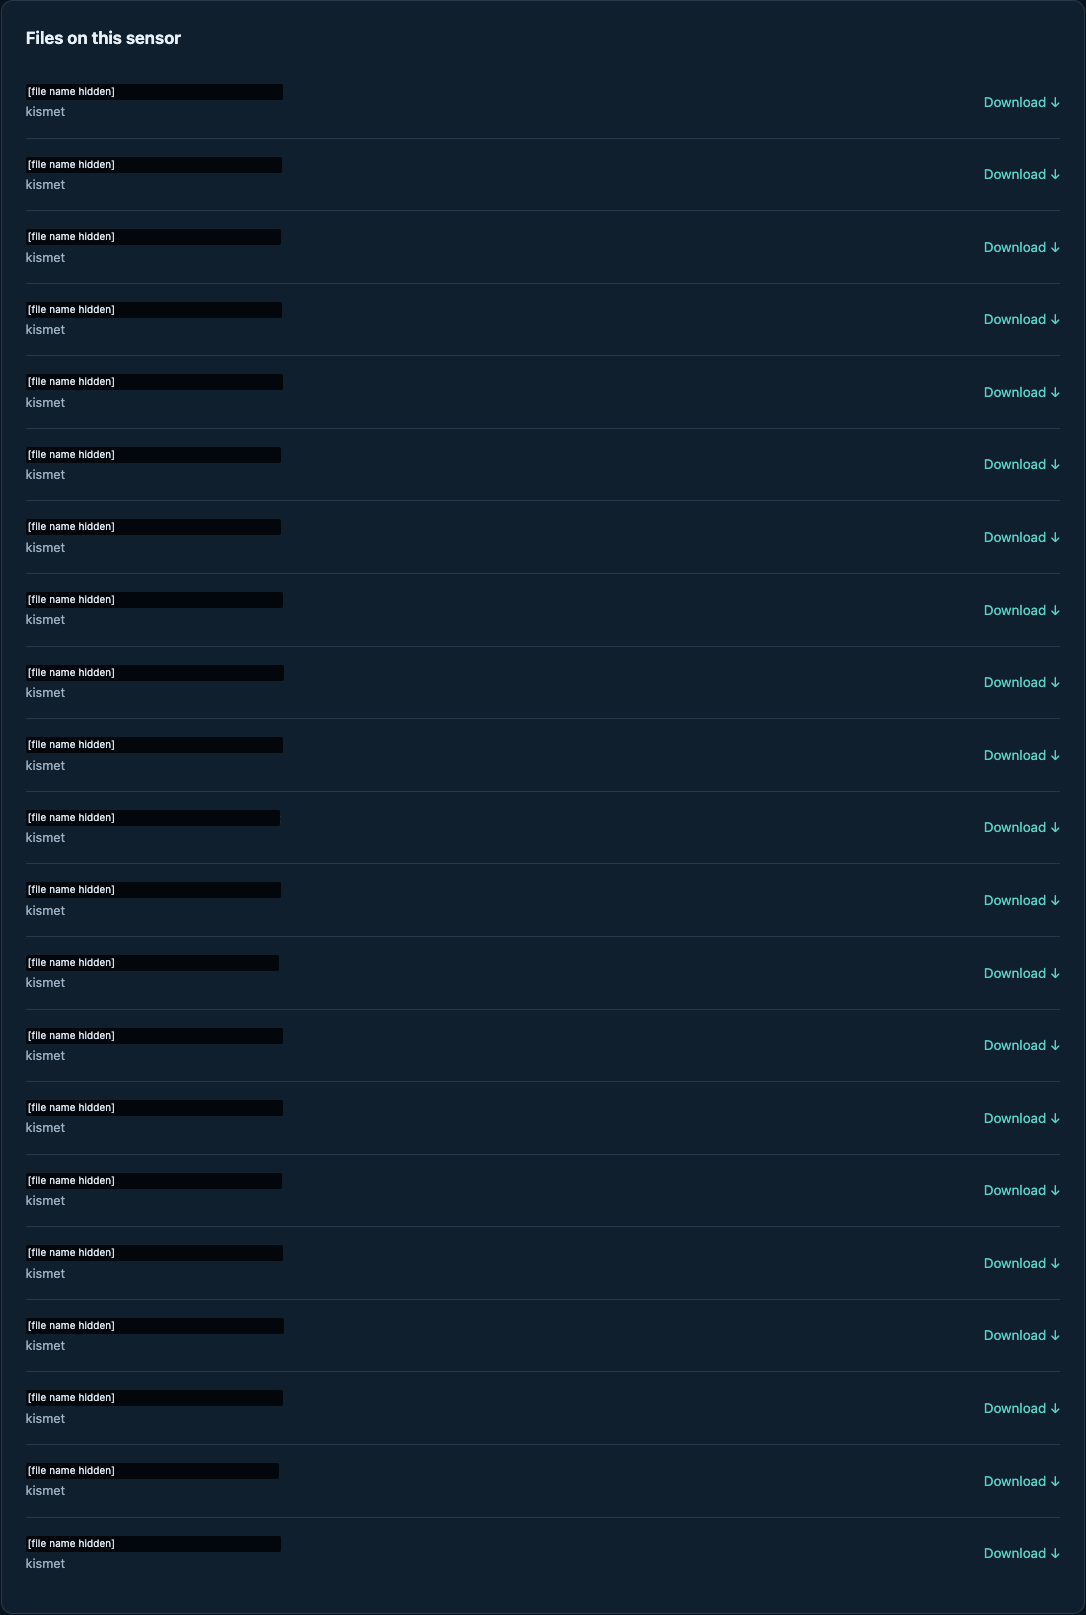
- Under Files on this sensor, select Download ↓ for one file.
- To take several together, tick the runs and files you want and select Download investigation ZIP. The browser saves
commander-investigation.zip. - Export JSON ↓ downloads run metadata only.
Each page shows 100 runs and files; use Next and Previous for more.
Captures can contain private traffic. Review and redact them before sharing.
How to set up a RADIUS lab
The RADIUS page has tabs: Overview, Users & NAS, Certificates & Profiles, Tests, Reports and Advanced. CfreeRADIUS supports PAP users and an accounting API. Choose FreeRADIUS for managed EAP, certificates and enrollment profiles.
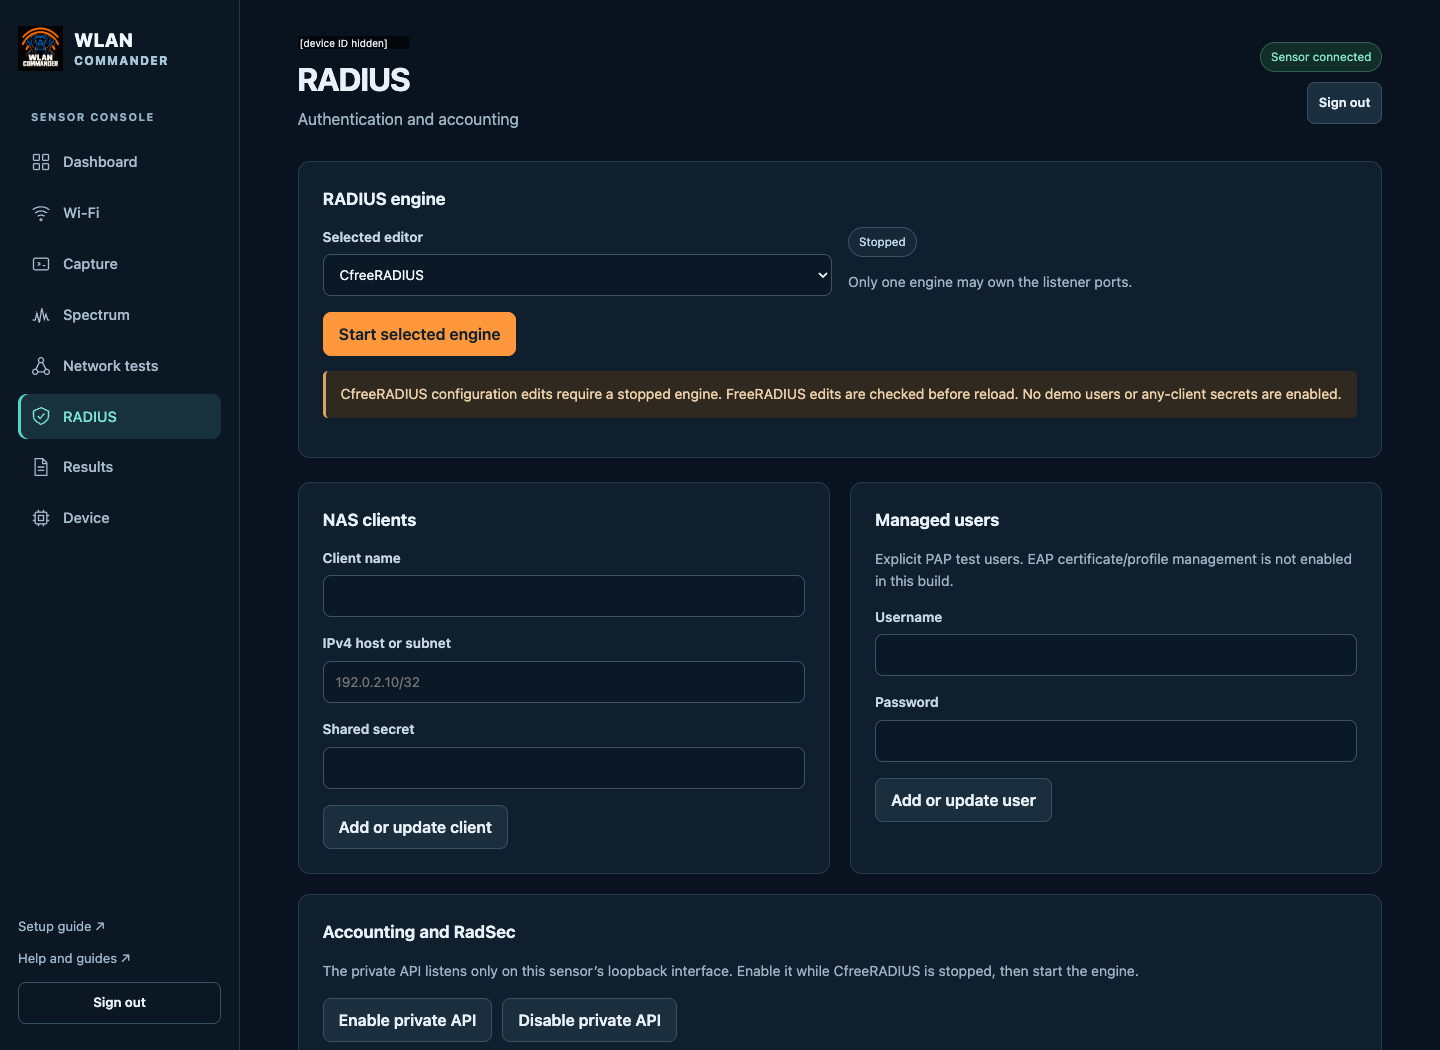
- On Overview, choose the Editing engine. An engine marked not installed cannot be started.
- With CfreeRADIUS, make sure it is stopped: it must be stopped while you edit clients and users. FreeRADIUS checks each change and restarts itself if it is running.
- Open Users & NAS. In NAS clients, enter Client name, IPv4 host or subnet (for example
192.0.2.10/32) and Shared secret, then select Add or update client. - In Managed users, enter a Username, set Authentication method to PAP, enter a Password, then select Save user.
- Back on Overview, in RADIUS service, select Start selected engine. The badge changes to Running. Only one engine runs at a time: starting one moves the shared ports to it.
- Open Tests. In Local password probe, choose the Managed password user and select Run local probe. The outcome appears in Recent RADIUS jobs.
- Point your AP or controller at the sensor's address with the same shared secret.
Saved secrets are not shown again. Keep client addresses and usernames out of shared screenshots.
Going further. Tests also offers Run a live RADIUS test and Analyze an uploaded capture; findings land in Reports. Certificates & Profiles creates RADIUS certificates and Wi-Fi enrollment profiles (FreeRADIUS). For CfreeRADIUS accounting, open Advanced › Accounting and RadSec, select Enable private API while the engine is stopped, start the engine, then choose a Live view and select Read live data. Accounting arrives on UDP 1813 once your NAS sends it. Reverse CoA and Disconnect can change or disconnect a live client, and needs a matching session and a ready NAS connection.
Dashboard
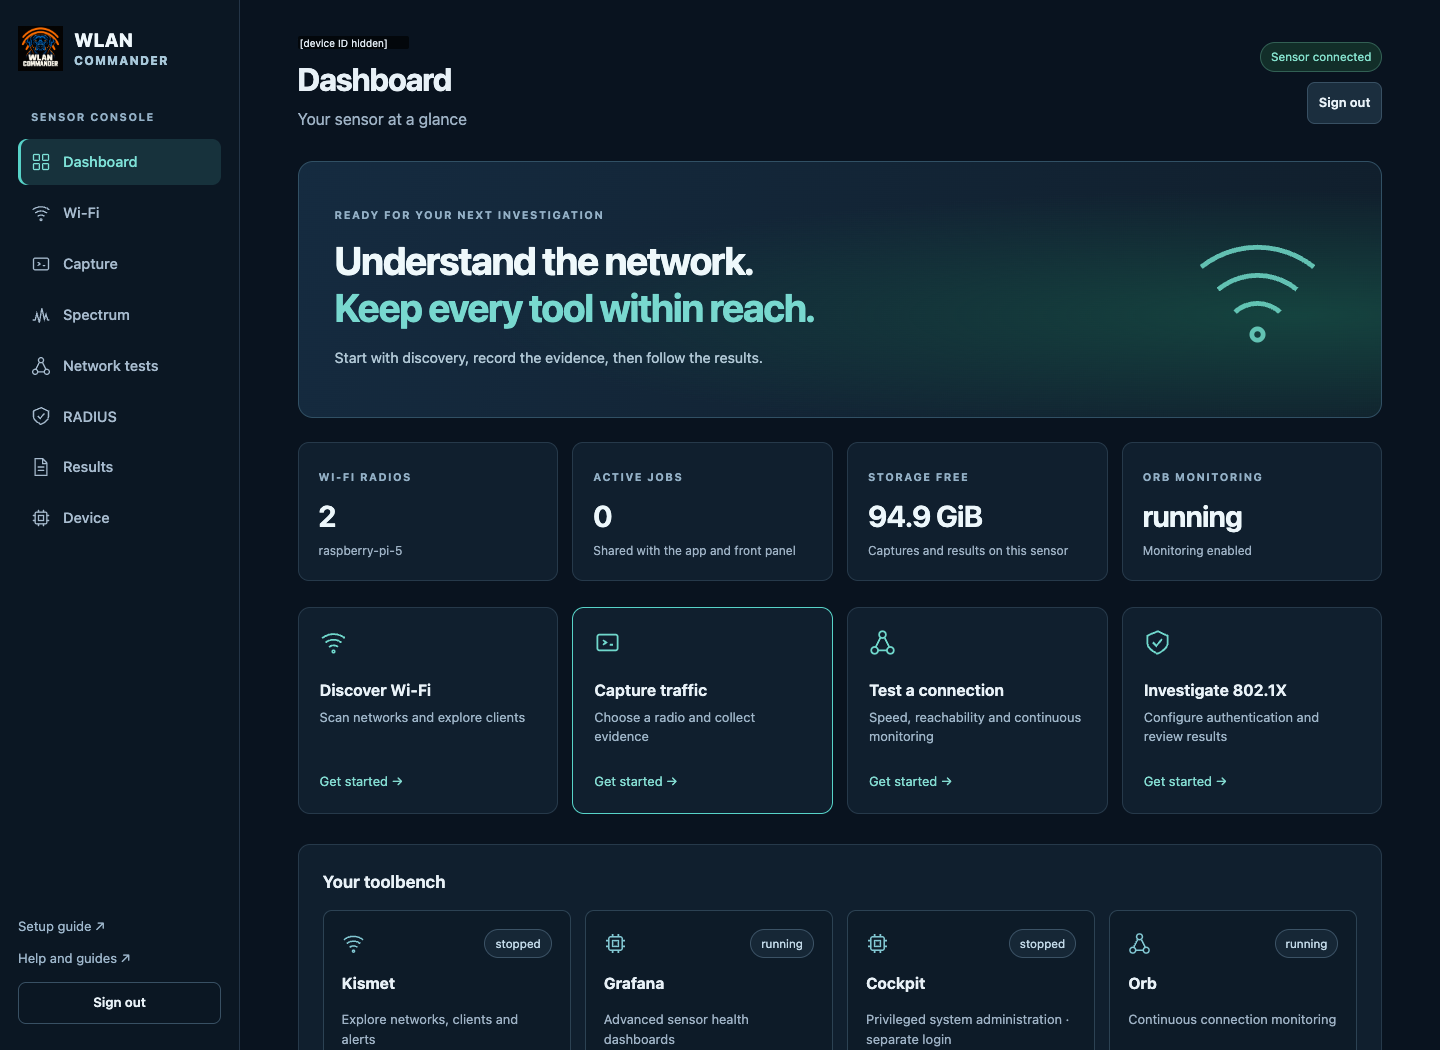
Check Sensor connected, the radio count, active jobs and free storage. An active job may already own a radio or USB analyzer; stop it before starting another tool on that resource. Get started links to common tasks, and Your toolbench shows which expert tools are running.
| Page | Use it to… |
|---|---|
| Wi-Fi | Run Profiler, Kismet or Scanner |
| Capture | Record traffic on an available radio |
| Spectrum | View a supported RF analyzer or WCN7850 FFT |
| RF tests | Run finite packet and tone tests with a USB ESP32-C5 |
| Network tests | Measure a path, check connectivity or manage Orb |
| RADIUS | Run a RADIUS lab and read accounting |
| Results | Review runs and download files |
| Device | Check health, pair Bluetooth input and update a supported ESP32-C5 |
| Integrations | Tailscale, scoped API credentials, MQTT and local AI agents (developer docs) |
| Security | Import CA-signed certificates or set up private ACME (PKI) |
Spectrum
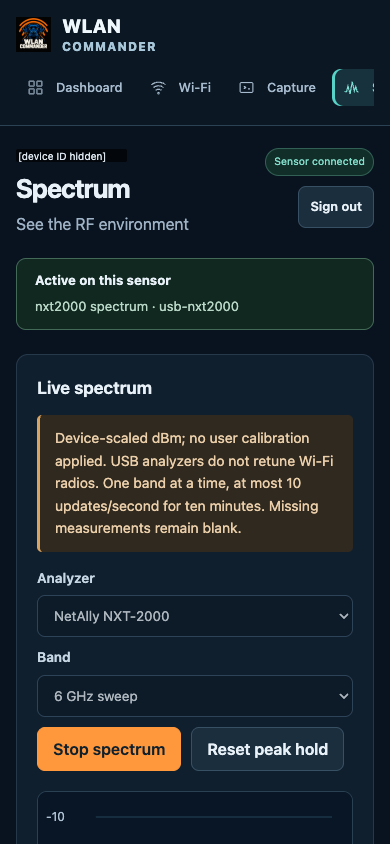
- Open Spectrum and choose an Analyzer. Unavailable choices need hardware or an installed capability.
- Choose a Band, then select Start spectrum.
- Read the teal FFT trace, the orange peak hold and the waterfall. Reset peak hold clears the peaks.
- Select Stop spectrum to release the analyzer. Stop before changing analyzer or band.
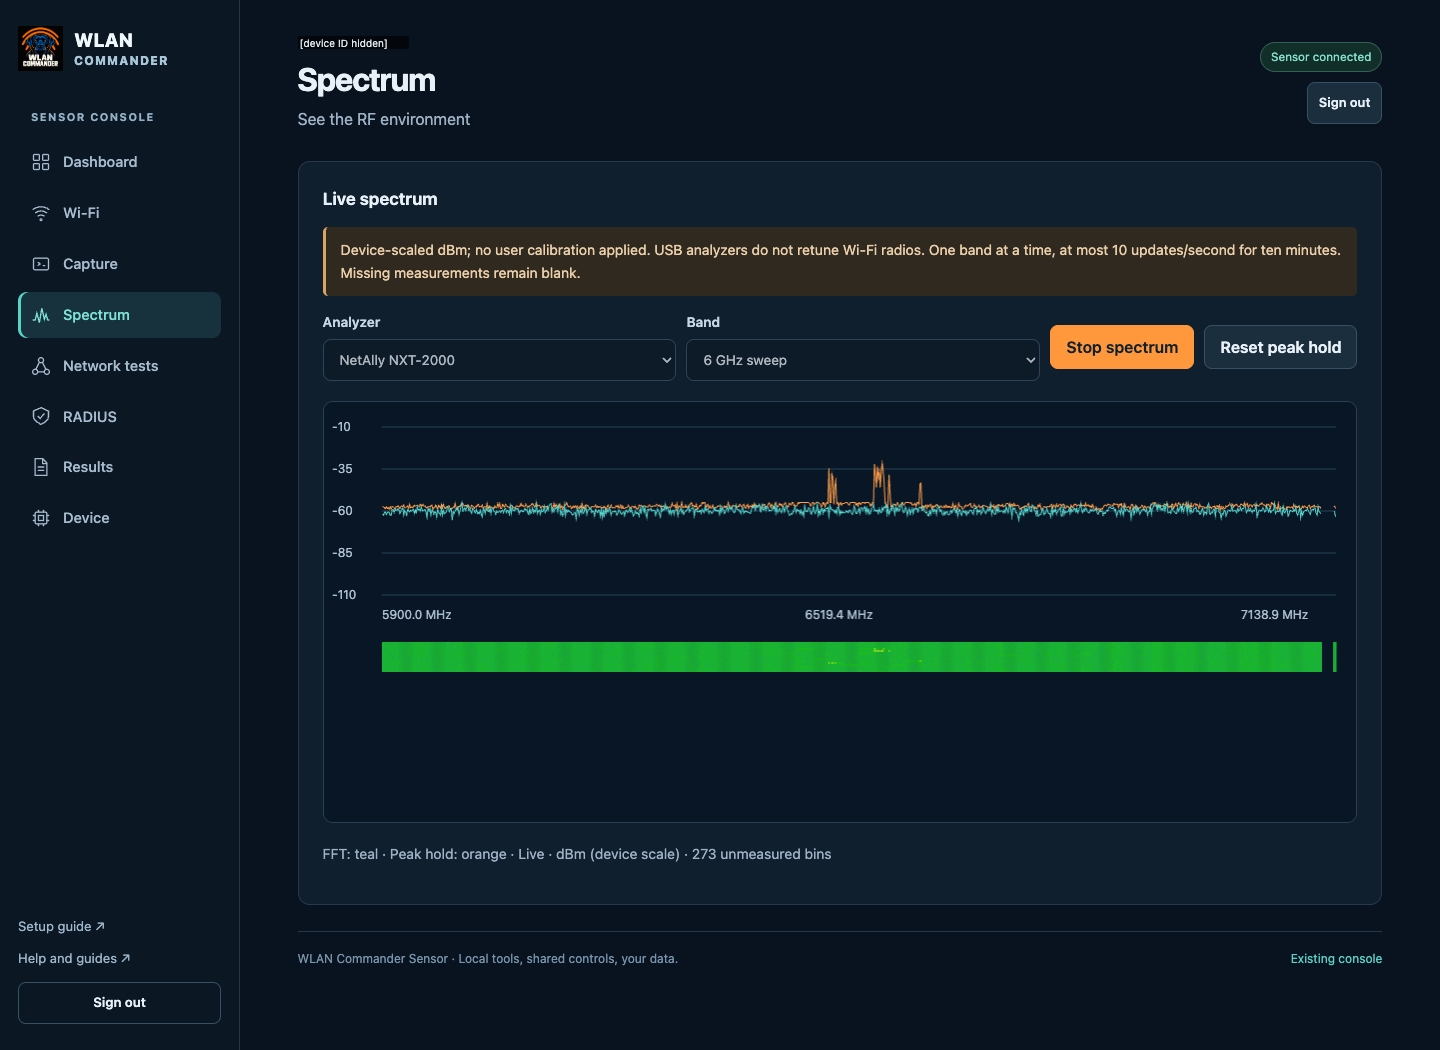
- NetAlly NXT-2000: 2.4, 5 and 6 GHz sweeps in dBm on the device's own scale, without user calibration. USB analyzers do not retune your Wi-Fi radio.
- Pi 5 with WCN7850: sweeps the offered 5 or 6 GHz channels one at a time, 64 FFT bins per channel. Levels are relative, uncalibrated magnitudes, not dBm. It refuses to retune an associated radio.
- WiPry Clarity: detected, but its live stream is unverified; you may see a no-data error.
Sessions last up to ten minutes. Missing measurements stay blank, and analyzer saturation is reported.
ESP32-C5 grouped spectrum (experimental)
Connect supported ESP32-C5 boards with compatible development firmware to the sensor's USB host. You can back up and update a board deliberately through Device › ESP32 firmware; nothing flashes automatically. On Spectrum, choose ESP32-C5 · grouped USB boards, select the boards, choose 2.4 or 5 GHz, and select Start spectrum.
The tested two-board setup gave 83-bin 2.4 GHz and 375-bin 5 GHz sweeps. Levels are relative and uncalibrated, with time gaps. 6 GHz is not supported. The page accepts one to six boards; three to six are not yet qualified. One board cannot capture, transmit and scan spectrum at the same time.
Network tests and Orb
- Browser ↔ sensor speed: select Run speed test. It measures the path from your browser to the sensor and saves the result in Results. It is a LAN measurement, not an internet speed rating.
- iPerf3 and xfr listeners: choose Listen on, start a listener, and connect a client to that address and port. Listeners stop after fifteen minutes, or when you select Stop.
- Reachability and DNS: choose ping, traceroute or DNS lookup, enter a Host or IP, and select Run check.
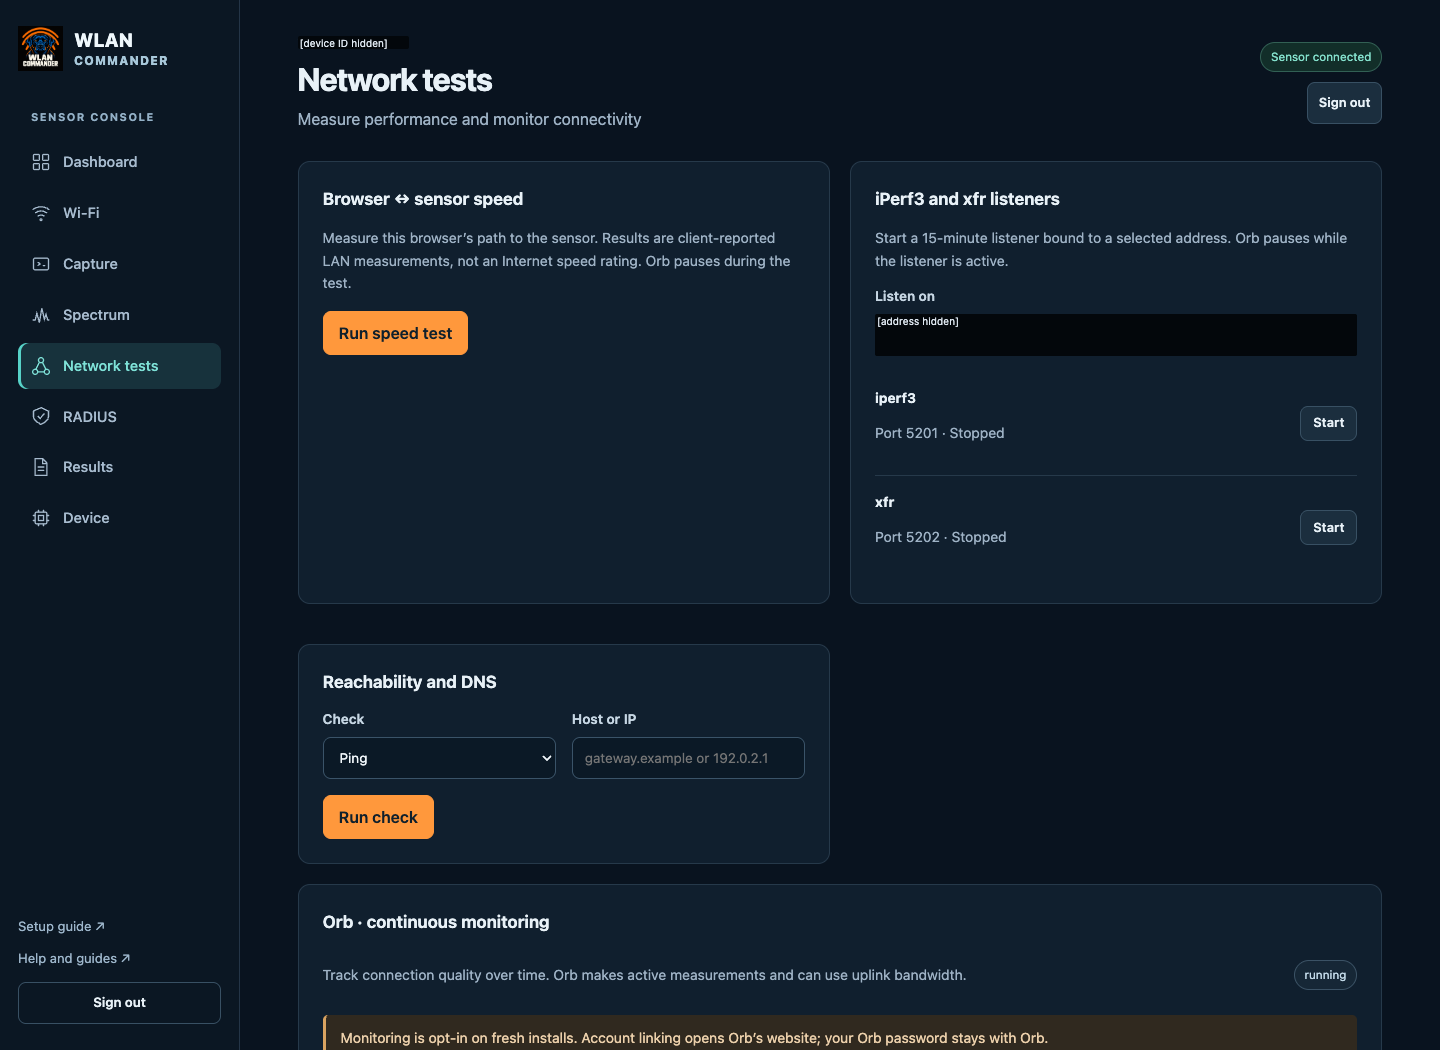
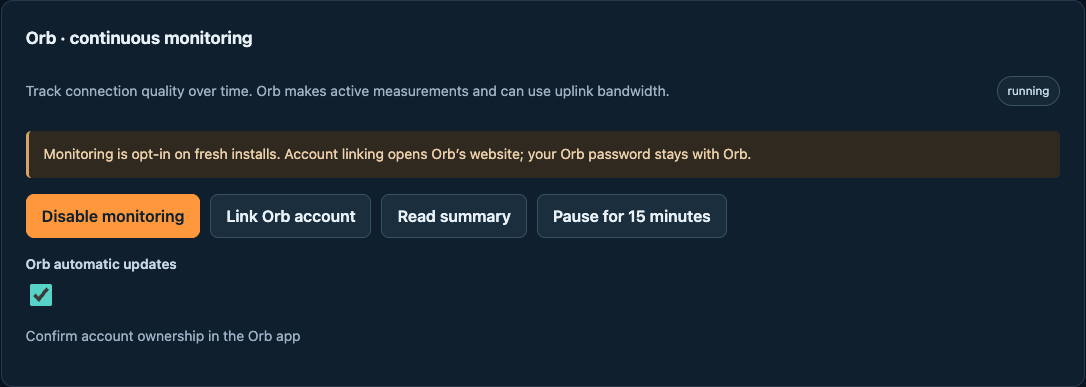
Orb · continuous monitoring is further down the page and is off on a fresh image. Enable monitoring / Disable monitoring turn it on and off. Link Orb account opens the vendor's linking flow and needs internet; Commander never asks for your Orb password. Read summary shows the vendor summary, which may contain private account details. Pause for 15 minutes and Resume my pause pause it briefly, and Orb automatic updates is a separate choice. Managed speed tests and listeners pause Orb so it does not compete with the measurement. See Network testing for each tool's scope.
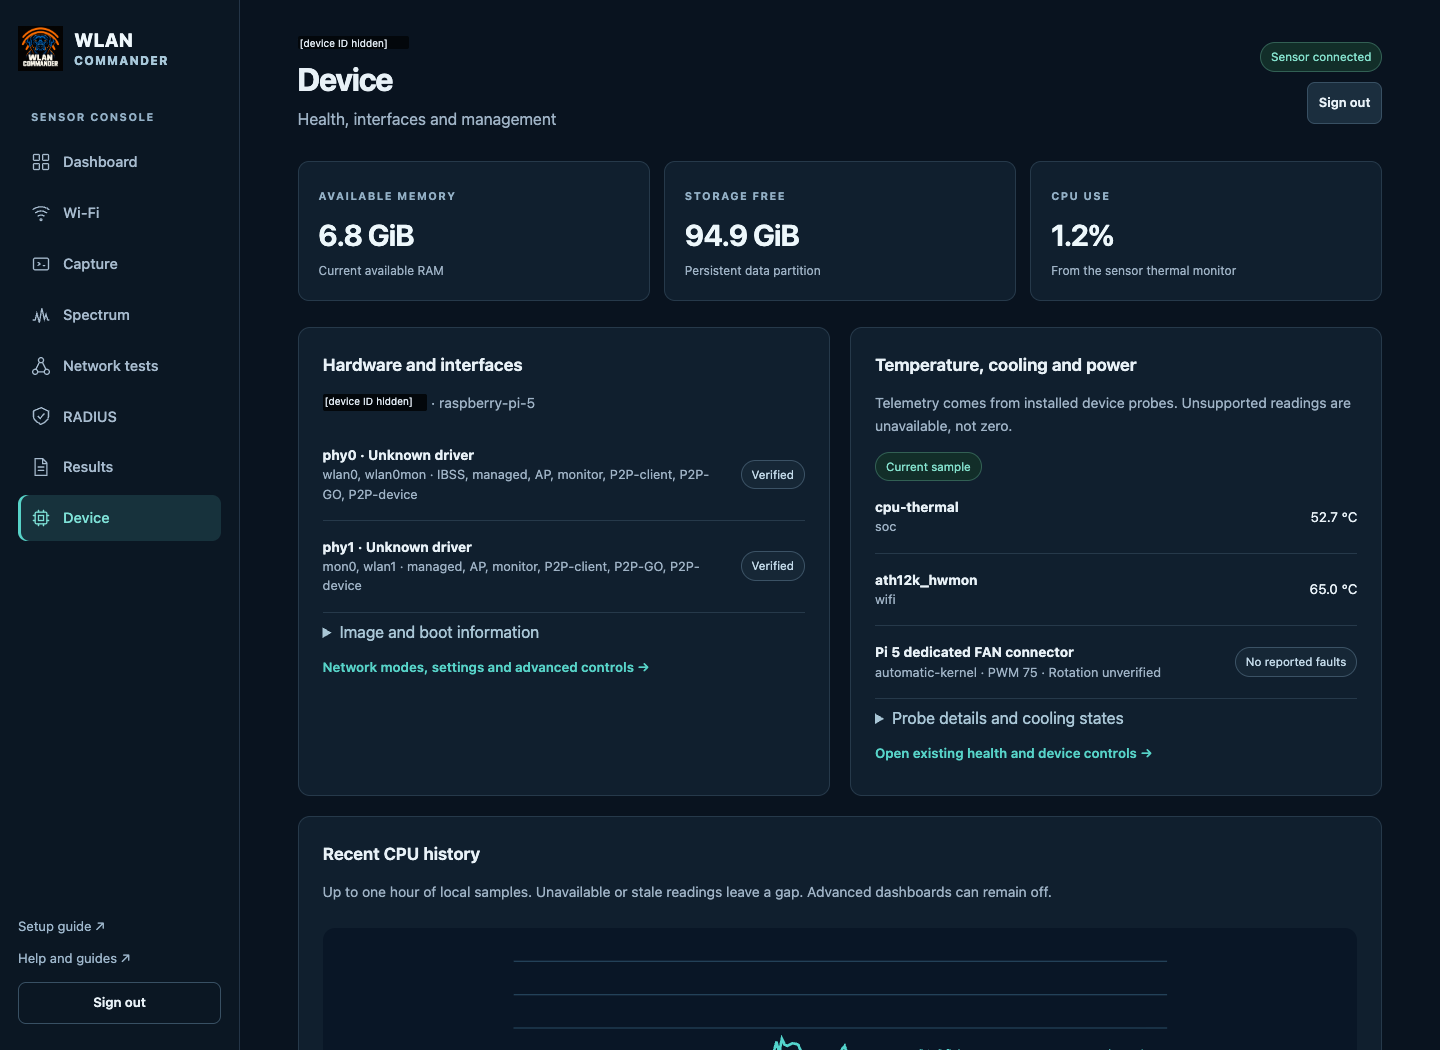
Device: health and expert tools
Device shows memory, storage, CPU history, temperatures and cooling. Unavailable or stale readings are labelled; an unavailable temperature is not zero. A PWM value or “No reported faults” does not prove a fan is turning.
Check storage health
The Storage health card shows what each drive and filesystem report, refreshed about once a minute. A value the drive does not report reads Not reported by this drive; nothing is estimated.
- Wear: life used in 10% steps and reserve-block status. Only eMMC reports this, such as the WLAN Pi Go's storage. SD cards and USB sticks report no wear, so a NanoPi, Raspberry Pi or Slate shows no percentage.
- Writes: lifetime writes per partition, and writes per day after 10 minutes of samples. The first 20 minutes after boot are left out, because boot writes tens of MB once.
- Errors: the filesystem error count, and a Read-only warning if a partition remounted read-only after an error. That usually means failing storage: back up Data and replace the card or drive.
On SD cards and USB sticks, watch writes per day. An idle Slate 7 Pro on the current image measured about 0.12 GB a day; other boards are not measured yet. A much higher idle figure points to a tool writing constantly. SMART data for NVMe and SATA drives is not read yet. See how the image cut its own storage writes.
Choose tools to fit your RAM
Use Available memory on Device: it includes cache Linux can reclaim, so it is more useful than free RAM. A nominal 2 GB board reports less than 2 GiB usable.
- 1 GB: run heavier tools such as Kismet and Grafana one at a time, on demand.
- 2 GB or more: recommended for several tools at once. Device count, capture settings and enabled services still matter.
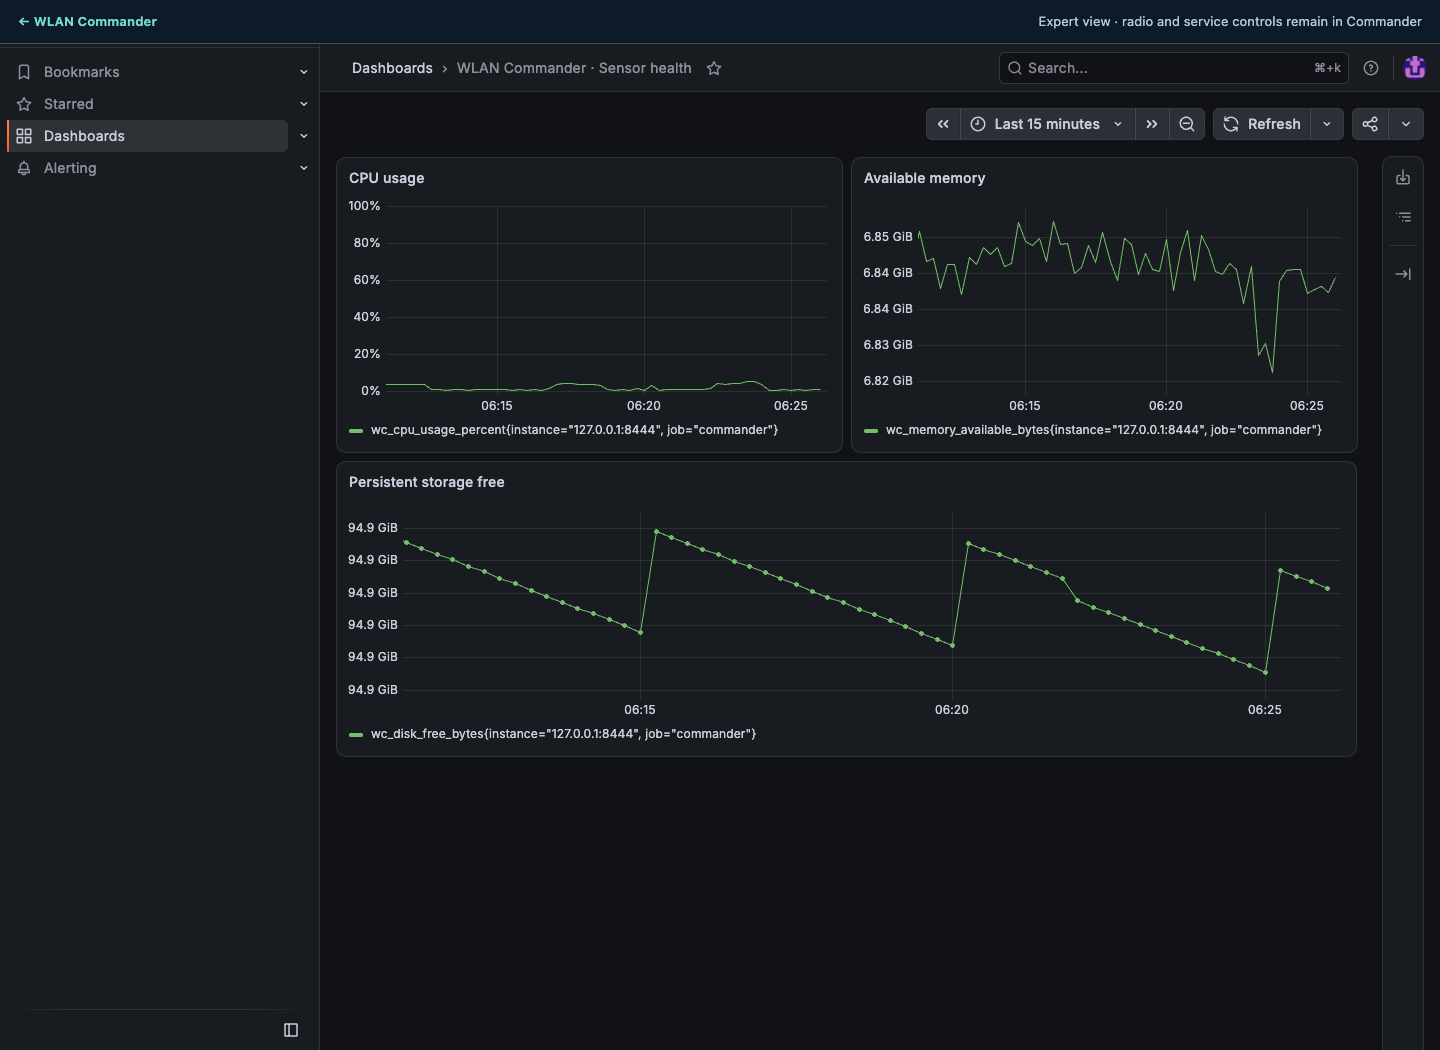
If available memory keeps falling, stop tools you are not using and select Disable dashboards. A busy Kismet session grows as it tracks devices. Opening browser tabs does not start sensor tools.
Advanced dashboards (Grafana and Prometheus) are an optional add-on, not part of the image. On Device, select Install to download the 244 MB add-on to Data and check its hash; a sensor without internet can upload the file, or the WLAN Commander app can copy it. Then select Enable dashboards and Open Grafana. Grafana uses a limited Viewer identity and shows sampled CPU, memory and storage. The add-on survives image updates; if an update cannot fetch a matching add-on, it holds and lets you upload the file or update without dashboards.
The image does not include Cockpit. A sensor that already had it keeps it through updates, where Enable Cockpit opens system administration with a separate login; its changes bypass Commander's job management. Network modes are under Existing console. Signed image updates come from the WLAN Commander app or sudo wc-update over SSH.
If it doesn't work
| What you see | What to do |
|---|---|
| Cannot reach the website | Check power and the current address. Confirm the USB cable carries data and enough power. Connect only one sensor by USB at a time. |
| Certificate fingerprint does not match | Stop. Check you opened the right sensor and compare again with its own WC-SETUP.TXT or setup record. |
| Sign-in rejected | Use this sensor's wlanpi password, the same as SSH. An idle session may need a new sign-in. |
| Tool unavailable or radio busy | Check attached hardware and which job owns the radio; stop that job and retry. |
| RADIUS says stop CfreeRADIUS before editing | Select Stop engine, make the change, then Start selected engine. |
| “Multiple engines are active” | Stop the other engine before testing. |
| Spectrum has gaps or no data | Gaps stay blank by design. Check the hardware and the status message. WiPry streaming is unverified. |
| Expert tool will not open | Start or enable it on its page, stay signed in to Commander, and use the return bar. |
| An update refuses after Kismet | Kismet can leave its monitor interface up after Stop, which blocks the update's safety check. Confirm no job or associated station uses it, then bring only that unused monitor interface down over SSH. |
Before sharing a screenshot, cover SSIDs, BSSIDs/MACs, public IPs, device identifiers, usernames, session IDs, account summaries and setup or linking codes with solid blocks. Captures, exports and logs need their own privacy review.
Credits and support
WLAN Commander integrates tools from the WLAN Pi community and other upstream projects; their authors keep credit, and expert interfaces keep their identities. Support for bundled WLAN Pi tools and scripts is limited, and inclusion does not imply upstream endorsement. Report integration issues with your board, image version, radio and redacted evidence.
Related
Installation and updates · Touchscreen and Bluetooth input · APIs, MQTT, PKI and MCP · ESP32-C5 updater · Network testing