In the hand,which one hears more?
These are handheld tools, so the comparison that counts is both of them held. A WLANPi Go against a NanoPi Zero2 with Osprey antennas, same Intel BE200, same channel plan, minutes apart. A free-standing sweep of each was captured as well, which is what lets the hand be separated from the hardware.
Held against held
the comparison that matters
As actually used — in a hand, phone attached — the NanoPi with Osprey antennas is +3.6 dB on 2.4 GHz and level on 5 and 6. Overall median across 72 paired access points: +1.1 dB.
The 2.4 GHz result is the decisive one: 20 of 25 access points louder on the NanoPi, only 4 on the Go. On 5 GHz the two are genuinely interchangeable — 14 to 14 with 11 ties.
Across the spectrum
median p95 per frequency, both held
Where the two lines sit apart, one device is genuinely hearing more at that frequency. The overall up-and-down is the neighbourhood, not the hardware — different access points live on different channels — so read the gap between the lines rather than the height of either. The smallest markers rest on a single access point and should not be read as a trend.
Every access point, both held
hollow = Go · filled = NanoPi
What the hand costs each device
same device, free-standing minus held
The free-standing sweeps exist to answer this: how much does each device lose when you pick it up? Comparing a device only against itself removes every other variable.
| Device | 2.4 GHz | 5 GHz | 6 GHz | Overall |
|---|---|---|---|---|
| WLANPi Go | +2.0 | +1.3 | +5.0 | +2.1 |
| NanoPi + Osprey | +1.5 | +1.0 | +1.4 | +1.3 |
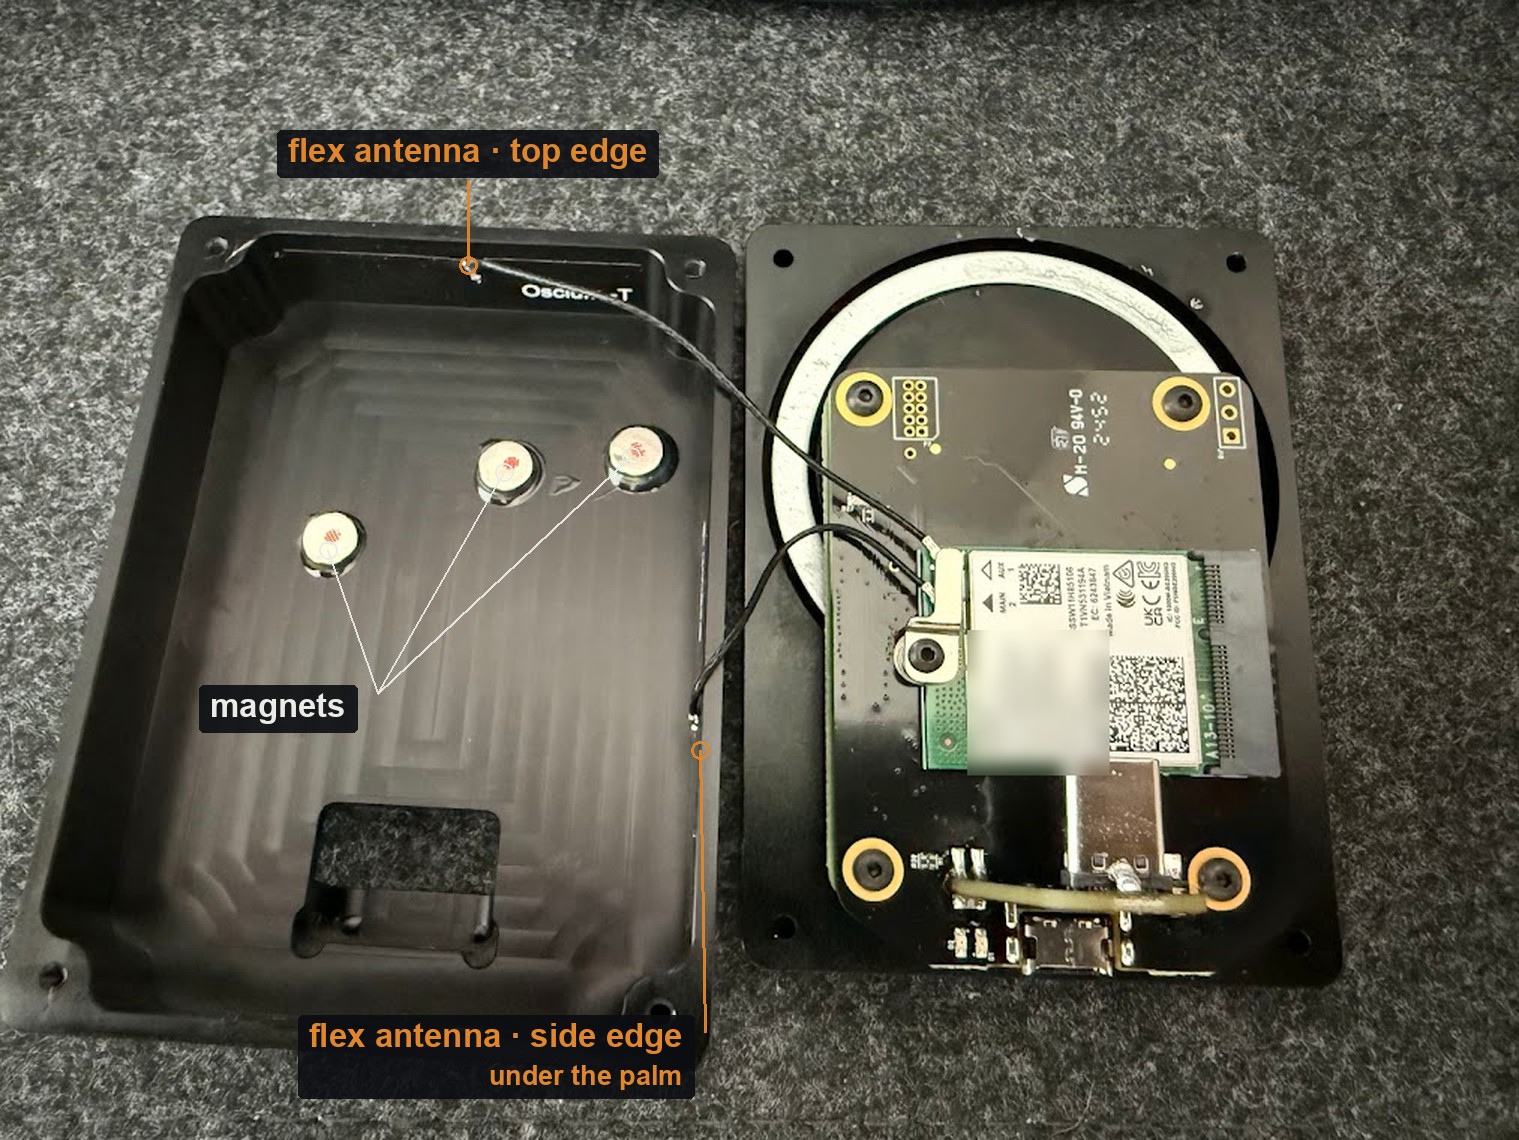
+2.1 dB against +1.3 dB overall, and on 6 GHz +5.0 against +1.4. The Osprey antennas stand proud of the case on their own connectors; the Go’s are films bonded to the inside of the shell, under the palm.
This is why the held comparison is the fair one for a handheld tool rather than a handicap against the Go. Being harder to detune is part of the hardware.
Free-standing, for reference
supporting data
With both devices set down and untouched the gap narrows, exactly as the hand-cost table predicts: 2.4 GHz +2.1 · 5 GHz +0.6 · 6 GHz +0.5, overall +1.0 dB across 81 paired access points. The NanoPi keeps a real 2.4 GHz lead; roughly a third of its advantage when held is the hand rather than the antennas.
| Condition | 2.4 GHz | 5 GHz | 6 GHz | Overall |
|---|---|---|---|---|
| Both held | +3.6 | +0.0 | -0.2 | +1.1 |
| Both free-standing | +2.1 | +0.6 | +0.5 | +1.0 |
How many each one found
APs with 5+ beacons on their home channel
| Condition | WLANPi Go | NanoPi + Osprey |
|---|---|---|
| Held | 82 | 77 |
| Free-standing | 89 | 82 |
Against our own interest, and worth stating plainly: the Go counts more access points in both conditions even while reading slightly quieter on the ones both hear. Signal strength and how many APs clear the detection threshold are different measurements, and this run does not disentangle them.
The full table, both held
p95 dBm
| Network | Band | Ch | Go | NanoPi | Δ | beacons |
|---|---|---|---|---|---|---|
| Network 10 | 2.4 | 1 | -65.0 | -62.0 | +3.0 | 26/26 |
| Network 11 | 2.4 | 1 | -78.3 | -75.0 | +3.3 | 27/19 |
| Network 15 | 2.4 | 1 | -65.0 | -61.2 | +3.8 | 25/26 |
| Network 23 | 2.4 | 1 | -65.0 | -61.5 | +3.5 | 25/31 |
| Network 12 | 2.4 | 5 | -82.8 | -78.0 | +4.8 | 19/21 |
| Network 10 | 2.4 | 6 | -60.0 | -51.0 | +9.0 | 28/25 |
| Network 15 | 2.4 | 6 | -60.0 | -51.0 | +9.0 | 22/29 |
| Network 23 | 2.4 | 6 | -59.0 | -51.0 | +8.0 | 29/28 |
| Network 25 | 2.4 | 6 | -59.0 | -55.4 | +3.6 | 27/28 |
| Network 27 | 2.4 | 6 | -51.0 | -53.0 | -2.0 | 30/24 |
| Network 27 | 2.4 | 6 | -66.0 | -60.0 | +6.0 | 27/13 |
| Network 27 | 2.4 | 6 | -57.0 | -50.1 | +6.9 | 29/23 |
| Network 28 | 2.4 | 6 | -57.3 | -56.0 | +1.3 | 27/28 |
| Network 31 | 2.4 | 6 | -67.2 | -60.0 | +7.2 | 24/25 |
| Network 34 | 2.4 | 6 | -70.5 | -63.4 | +7.1 | 26/28 |
| Network 35 | 2.4 | 6 | -86.0 | -77.0 | +9.0 | 24/19 |
| Network 33 | 2.4 | 8 | -78.0 | -68.0 | +10.0 | 18/17 |
| Network 10 | 2.4 | 11 | -64.0 | -69.0 | -5.0 | 22/22 |
| Network 10 | 2.4 | 11 | -39.0 | -36.0 | +3.0 | 29/26 |
| Network 15 | 2.4 | 11 | -39.0 | -36.0 | +3.0 | 29/25 |
| Network 15 | 2.4 | 11 | -64.0 | -69.0 | -5.0 | 22/25 |
| Network 20 | 2.4 | 11 | -54.0 | -54.0 | +0.0 | 23/29 |
| Network 23 | 2.4 | 11 | -64.0 | -69.0 | -5.0 | 22/27 |
| Network 23 | 2.4 | 11 | -39.0 | -36.0 | +3.0 | 27/27 |
| Network 26 | 2.4 | 11 | -79.0 | -74.2 | +4.8 | 21/26 |
| Network 01 | 5 | 36 | -52.0 | -60.3 | -8.3 | 25/27 |
| Network 01 | 5 | 36 | -67.0 | -70.0 | -3.0 | 26/28 |
| Network 35 | 5 | 36 | -90.0 | -89.0 | +1.0 | 23/32 |
| Network 11 | 5 | 44 | -84.0 | -85.0 | -1.0 | 26/26 |
| Network 28 | 5 | 44 | -85.0 | -84.2 | +0.8 | 26/26 |
| Network 19 | 5 | 48 | -88.0 | -86.0 | +2.0 | 28/24 |
| Network 09 | 5 | 56 | -57.0 | -59.2 | -2.2 | 26/25 |
| Network 15 | 5 | 56 | -57.0 | -59.2 | -2.2 | 26/25 |
| Network 16 | 5 | 56 | -57.0 | -59.2 | -2.2 | 26/25 |
| Network 23 | 5 | 56 | -57.0 | -59.2 | -2.2 | 27/25 |
| Network 36 | 5 | 56 | -57.0 | -59.2 | -2.2 | 26/25 |
| Network 37 | 5 | 56 | -57.0 | -59.2 | -2.2 | 27/25 |
| Network 09 | 5 | 60 | -53.0 | -53.0 | +0.0 | 26/24 |
| Network 15 | 5 | 60 | -53.2 | -53.0 | +0.2 | 26/25 |
| Network 16 | 5 | 60 | -53.2 | -53.2 | +0.0 | 26/25 |
| Network 23 | 5 | 60 | -53.2 | -53.2 | +0.0 | 26/25 |
| Network 36 | 5 | 60 | -53.0 | -53.0 | +0.0 | 26/25 |
| Network 37 | 5 | 60 | -53.0 | -53.0 | +0.0 | 26/24 |
| Network 03 | 5 | 116 | -36.0 | -28.0 | +8.0 | 24/25 |
| Network 09 | 5 | 120 | -38.4 | -41.0 | -2.6 | 29/24 |
| Network 15 | 5 | 120 | -38.4 | -41.0 | -2.6 | 29/25 |
| Network 16 | 5 | 120 | -38.4 | -41.0 | -2.6 | 29/25 |
| Network 23 | 5 | 120 | -38.4 | -41.0 | -2.6 | 29/25 |
| Network 36 | 5 | 120 | -38.0 | -41.0 | -3.0 | 29/25 |
| Network 37 | 5 | 120 | -38.0 | -41.0 | -3.0 | 29/23 |
| Network 03 | 5 | 132 | -62.0 | -60.0 | +2.0 | 24/25 |
| Network 09 | 5 | 140 | -65.0 | -63.0 | +2.0 | 28/25 |
| Network 15 | 5 | 140 | -65.0 | -63.0 | +2.0 | 28/25 |
| Network 16 | 5 | 140 | -65.0 | -63.0 | +2.0 | 28/24 |
| Network 23 | 5 | 140 | -65.0 | -63.0 | +2.0 | 28/25 |
| Network 36 | 5 | 140 | -65.0 | -63.0 | +2.0 | 25/25 |
| Network 37 | 5 | 140 | -65.0 | -63.0 | +2.0 | 28/25 |
| Network 25 | 5 | 149 | -56.0 | -56.0 | +0.0 | 27/27 |
| Network 28 | 5 | 149 | -55.3 | -56.0 | -0.7 | 27/27 |
| Network 20 | 5 | 157 | -61.2 | -56.0 | +5.2 | 26/27 |
| Network 21 | 5 | 157 | -61.2 | -56.0 | +5.2 | 26/27 |
| Network 22 | 5 | 157 | -61.2 | -56.0 | +5.2 | 26/27 |
| Network 28 | 5 | 157 | -70.3 | -69.0 | +1.3 | 28/28 |
| Network 31 | 5 | 157 | -70.3 | -69.0 | +1.3 | 28/28 |
| Network 02 | 6 | 5 | -54.0 | -59.2 | -5.2 | 20/25 |
| Network 31 | 6 | 53 | -85.0 | -88.2 | -3.2 | 21/25 |
| Network 24 | 6 | 69 | -48.0 | -43.2 | +4.8 | 21/26 |
| Network 24 | 6 | 133 | -69.0 | -68.0 | +1.0 | 27/26 |
| Network 24 | 6 | 165 | -59.0 | -56.0 | +3.0 | 20/26 |
| Network 03 | 6 | 197 | -49.0 | -49.2 | -0.2 | 25/26 |
| Network 04 | 6 | 197 | -49.0 | -49.2 | -0.2 | 25/26 |
| Network 24 | 6 | 197 | -61.9 | -62.0 | -0.1 | 20/25 |
How the numbers were made
method
Beacons only, p95 of RSSI in dBm. Access points are paired by BSSID and frequency, never by name, because multi-BSSID radios reuse one SSID across bands.
Each BSSID gets a home frequency — the modal one across all four captures, so every sweep is cut identically — and beacons heard while the radio was tuned elsewhere are discarded. A pair needs 5+ beacons on both sides. Hidden and malformed SSIDs are excluded.
All four captures were checked to be single-radio and tri-band before anything was compared: one interface block each, roughly 50 frequencies, reaching 7095 MHz. That check is not optional. A device that splits its sweep across two radios — a BE200 and a built-in Broadcom, say — pools into a figure that compares one vendor's radio against another's on a third of the channels.
Original research and documentation by WLAN Geeks. Sources and credits · Report a documentation issue